فائل:2005cinnamon (canella).PNG
اس نمائش کا حجم: 800 × 351 پکسلز۔ دیگر تصمیمات: 320 × 140 پکسلز | 640 × 281 پکسلز | 1,425 × 625 پکسلز۔
اصل فائل (1,425 × 625 پکسل، فائل کا حجم: 57 کلوبائٹ، MIME قسم: image/png)
.PNG)
خلاصہ

|
This economic map image could be re-created using vector graphics as an SVG file. This has several advantages; see Commons:Media for cleanup for more information. If an SVG form of this image is available, please upload it and afterwards replace this template with
{{vector version available|new image name}}.
It is recommended to name the SVG file “2005cinnamon (canella).svg”—then the template Vector version available (or Vva) does not need the new image name parameter. |
| تفصیل |
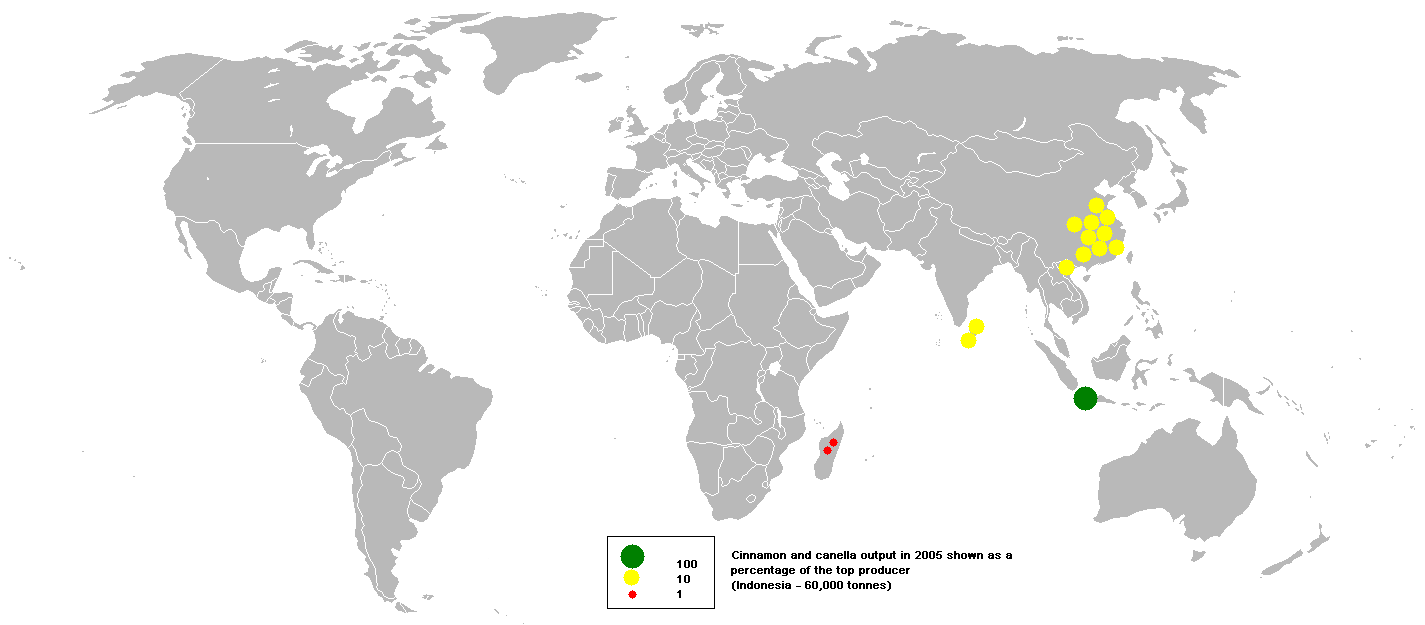
English: This bubble map shows the global distribution of cinnamon and canella output in 2005 as a percentage of the top producer (Indonesia - 60,000 tonnes).
This map is consistent with incomplete set of data too as long as the top producer is known. It resolves the accessibility issues faced by colour-coded maps that may not be properly rendered in old computer screens. Data was extracted on 14th June 2007 from http://faostat.fao.org/site/336/DesktopDefault.aspx?PageID=336 Based on :Image:BlankMap-World.png According to the International Herald Tribune, in 2006 Sri Lanka produced 90% of the world's cinnamon, followed by China, India, and Vietnam.[15] According to the FAO, Indonesia produces 40% of the world's Cassia genus of cinnamon. |
| تاریخ | 14 جون 2007 (original upload date) |
| ماخذ | Transferred from en.wikipedia to Commons by Stefan4 using CommonsHelper. |
| مصنف | Anwar saadat at انگریزی ویکیپیڈیا |
اجازہ کاری
اس تخلیقی کام کے حقوق کا مالک Anwar saadat at انگریزی ویکیپیڈیا اسے مندرجہ ذیل اجازت نامے کے تحت شائع کرتا ہے:
اس ملف کا لائسنس Creative Commons Attribution-Share Alike 3.0 Unported کے تحط ہے۔
لگاؤ: Anwar saadat at انگریزی ویکیپیڈیا
- آپ آزاد ہیں:
- شیئر کرنے – کام کو نقل، تقسیم یا منتقل کرنے کے لیے
- ریمکس کے لیے – کام منبطق کرنے کے لیے
- مندرجہ ذیل شرائط کے تحت:
- انتساب – آپ کو اس کام کا انتساب مصنف یا اجازت دہندہ کے بتائے گئے طریقہ کے مطابق دینا ہوگا (تاہم یہ انتساب اس طرح نہیں ہونا چاہیے کہ اسے دیکھ کر ایسا محسوس ہو کہ اصل مصنف یا اجازت دہندہ آپ کے یا آپ کے ذریعہ اس کام کے استعمال کرنے کے حامی ہیں)۔
- یکساں شراکت – اگر آپ اس کام میں کوئی تبدیلی یا ترمیم کرتے ہیں یا اس کام پر مبنی کچھ نیا بناتے ہیں تو اسے بھی آپ اسی یا اس جیسے کسی اجازت نامے کے تحت شائع کر سکتے ہیں۔
اولین اپلوڈ کا نوشتہ
فائل کی تفصیلات کا اصل صفحہ یہاں تھا۔ درج ذیل تمام صارفین en.wikipedia کے ہیں۔
- 2007-06-14 17:56 Anwar saadat 1425×625× (58742 bytes)
فائل کا تاریخچہ
کسی خاص وقت یا تاریخ میں یہ فائل کیسی نظر آتی تھی، اسے دیکھنے کے لیے اس وقت/تاریخ پر کلک کریں۔
| تاریخ/وقت | تھمب نیل | ابعاد | صارف | تبصرہ | |
|---|---|---|---|---|---|
| رائج الوقت | 19:49، 10 نومبر 2011ء | | 1,425 × 625 (57 کلوبائٹ) | File Upload Bot (Magnus Manske) | {{BotMoveToCommons|en.wikipedia|year={{subst:CURRENTYEAR}}|month={{subst:CURRENTMONTHNAME}}|day={{subst:CURRENTDAY}}}} {{Information |Description={{en|This bubble map shows the global distribution of cinnamon a |
روابط
اس فائل سے مربوط کوئی صفحہ موجود نہیں ہے۔
فائل کا عالمی استعمال
مندرجہ ذیل ویکیوں میں یہ فائل زیر استعمال ہے:
- en.wikipedia.org پر استعمال
- gu.wikipedia.org پر استعمال
- hr.wikipedia.org پر استعمال
- ta.wikipedia.org پر استعمال
.PNG)