فائل:Vijay Hazare graph.png
اس نمائش کا حجم: 800 × 451 پکسلز۔ دیگر تصمیمات: 320 × 180 پکسلز | 640 × 360 پکسلز | 957 × 539 پکسلز۔
اصل فائل (957 × 539 پکسل، فائل کا حجم: 6 کلوبائٹ، MIME قسم: image/png)
خلاصہ
| تفصیل |
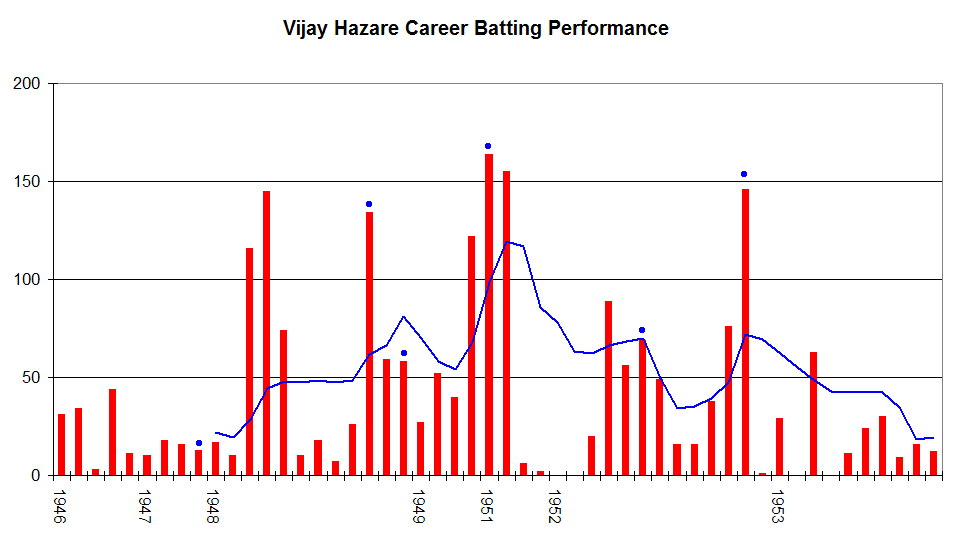
English: This graph details the Test Match performance of Vijay Hazare. It was created by Raven4x4x. The red bars indicate the player's test match innings, while the blue line shows the average of the ten most recent innings at that point. Note that this average cannot be calculated for the first nine innings. The blue dots indicate innings in which Hazare finished not-out.
This graph was generated with Microsoft Excel 2002, using data from Cricinfo and Howstat.com.au. |
| تاریخ | 25 جون 2006 (original upload date) |
| ماخذ |
ذاتی کام Transferred from en.wikipedia |
| مصنف | Raven4x4x at en.wikipedia |
اجازہ کاری
| |
تخلیق کار Raven4x4x, at the انگریزی ویکیپیڈیا project نے اس کام کو دائرہ عام میں شائع کیا ہے جس کا اطلاق عالمی سطح پر ہوتا ہے۔ In case this is not legally possible: |
اولین اپلوڈ کا نوشتہ
فائل کی تفصیلات کا اصل صفحہ یہاں تھا۔ درج ذیل تمام صارفین en.wikipedia کے ہیں۔
- 2006-06-25 06:49 Raven4x4x 957×539 (5807 bytes) This graph details the [[Test cricket|Test Match]] performance of [[Vijay Hazare]]. It was created by [[User:Raven4x4x|Raven4x4x]]. The red bars indicate the player's test match innings, while the blue line shows the [[Batting average|average]] of the ten
فائل کا تاریخچہ
کسی خاص وقت یا تاریخ میں یہ فائل کیسی نظر آتی تھی، اسے دیکھنے کے لیے اس وقت/تاریخ پر کلک کریں۔
| تاریخ/وقت | تھمب نیل | ابعاد | صارف | تبصرہ | |
|---|---|---|---|---|---|
| رائج الوقت | 23:53، 27 جولائی 2010ء | | 957 × 539 (6 کلوبائٹ) | MGA73bot2 | == {{int:filedesc}} == {{Information |description={{en|1=This graph details the Test Match performance of Vijay Hazare. It was created by Raven4x4x. The red bars indicate the player's test m |
روابط
درج ذیل صفحہ اس فائل کو استعمال کر رہا ہے:
فائل کا عالمی استعمال
مندرجہ ذیل ویکیوں میں یہ فائل زیر استعمال ہے:
- de.wikipedia.org پر استعمال
- en.wikipedia.org پر استعمال
- kn.wikipedia.org پر استعمال